Observability
Configuration
Logging
Pino is used for logging and is instrumented to include the trace/span ids.
import { logger } from '#o11y/logger';
In the .env file the configuration variables are:
LOG_LEVEL=debug
# Pino pretty logging. Set to false for structured JSON logging when running in server mode
LOG_PRETTY=true
Any TypeScript file which is used as an application entry point should being with the following import to ensure the logger is instrumented.
import '#fastify/trace-init/trace-init';
OpenTelemetry tracing
Tracing is implemented with OpenTelemetry. The environment variables which configure tracing are:
If you have completed the Google Cloud setup steps then update TRACE_AGENT_ENABLED to true.
As the default exporter is for Google Cloud Trace the Google Cloud user/service account will require the Cloud Trace Agent role (roles/cloudtrace.agent)
The TRACE_AUTO_INSTRUMENT variable enables the trace instrumentation from the @opentelemetry/auto-instrumentations-node package.
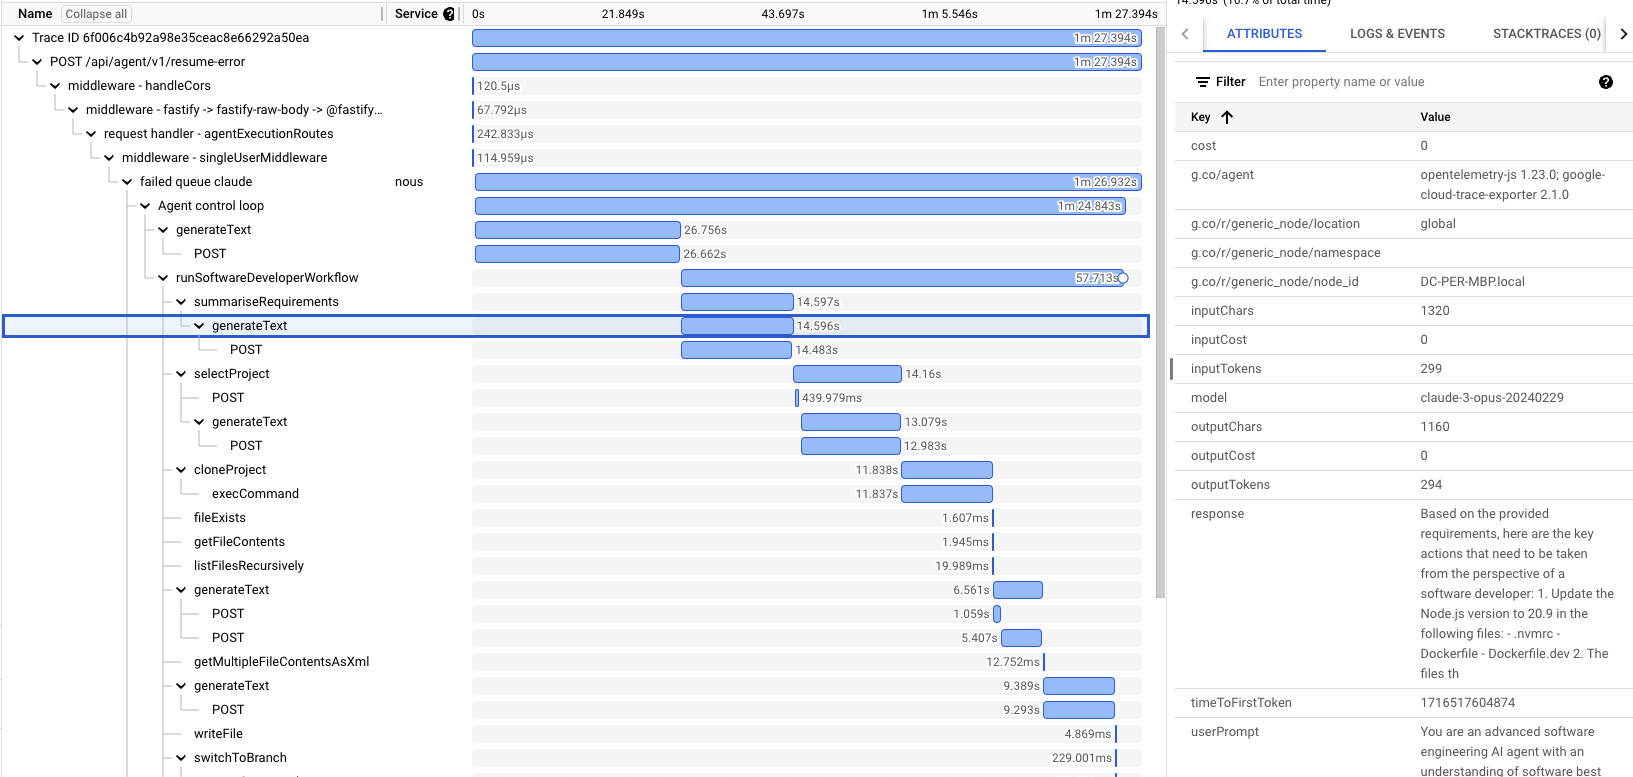
Sample trace
Tracing code
The @func annotation also creates a span for a function call, in addition to registering its function schema.
The @span annotation is available to create trace spans for any other class methods.
For non-class functions, or when you require more control over the span, the withActiveSpan method provides a callback with a Span object.
